Optical Coherence Imaging Laboratory
Amy L. Josefsberg, Professor
Department of Physics & Astronomy
Biomedical Research Imaging Center
University of North Carolina at Chapel Hill
Intracellular Motility Imaging via Inverse Power-Law OCT Fluctuation Spectroscopy
OCT provides both spatial and temporal information relevant to organoid function. In the temporal domain, by computing the speckle fluctuation spectrum from OCT images, we have shown that mammary epithelial organoids exhibit an apparent “motility” arising from in-place intracellular motion. This motility signal can be parameterized by two independent metrics: the inverse power-law exponent (a), and the fractional modulation amplitude (M), which are sensitive to functional cellular changes (Oldenburg et al., 2015; Oldenburg et al., 2013). In the spatial domain, we have shown that the OCT-based morphological features of mammary epithelial organoids (including size, lumen size, and asphericity) are sensitive to culture conditions as related to stromal-epithelial interactions (Chhetri et al., 2012). Taken together, OCT offers a unique platform for noninvasively and longitudinally assessing intracellular motion and morphology of 3D mammary epithelial cell organoids, which may be relevant for studying mechanisms of breast cancer (Yu et al,2018) -- see our application page here.
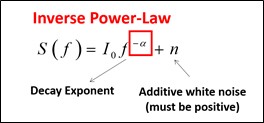
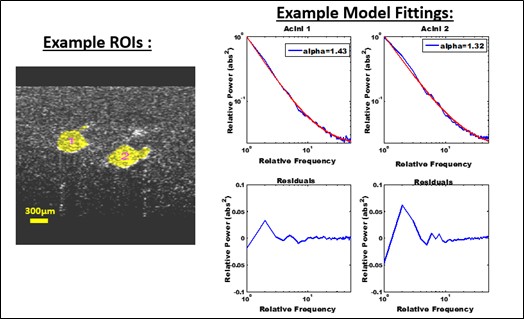
Fig. 1. Inverse Power Law model (top) and example model fitting (bottom right). The power spectrum of intracellular motility in vitro appears to be well-described by an inverse power law, where a is the exponent, I0 is the DC power of the OCT signal, and n is white noise (shot noise).
A complementary metric of fractional modulation amplitude to quantify the strength of the fluctuations was also employed, where the motility amplitude M was expressed as a modified standard deviation that was normalized by pixel intensity (Oldenburg et al., 2015), as shown in Fig.2.
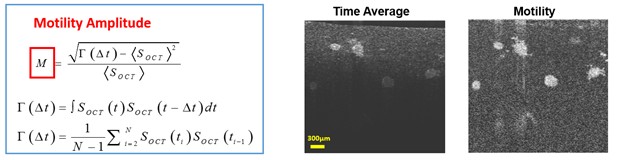
Fig. 2. Fractional modulation amplitude model and example: (a) Time-averaged OCT image. (b) Motility image obtained using the modified standard deviation method that omits random noise.
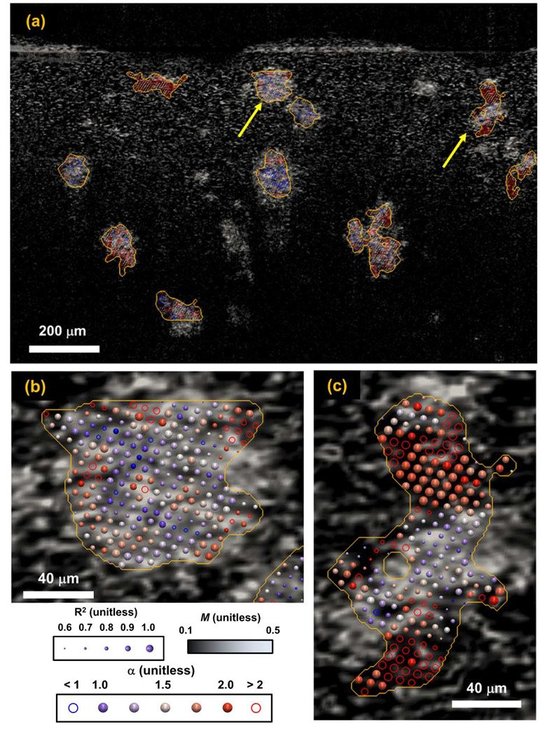
Fig. 3. Visualization of motility metrics of MEC organoids (pre-malignant) in 3D co-culture with RMF, where panels (b) and (c) are close-up views of organoids (yellow arrows) in panel (a). The background gray-scale image indicates M, and alpha is overlaid as a spherical glyph colored from blue to red to represent fluctuation spectra with more high-frequency or low-frequency components, respectively. Blue or red hollow glyphs indicate alpha values beyond the scale (<1 and >2, respectively). The size of the glyph represents R2 from the power-law fitting, with larger glyphs indicating alpha values with greater confidence. Yellow contour lines indicate the ROIs determined from segmentation of the time-averaged OCT image.
intro page - research - publications - people - open positions
UNC Physics & Astronomy - Biomedical Research Imaging Center - UNC Home